Hình ảnh hóa có khả năng thuyết phục, truyền đạt những ý tưởng của bạn và thể hiện hiệu suất công việc mà bạn đạt được, nhưng cho đên nay việc tạo ra một hình ảnh phù hợp có thể tốn khá nhiều thời gian và công sức.
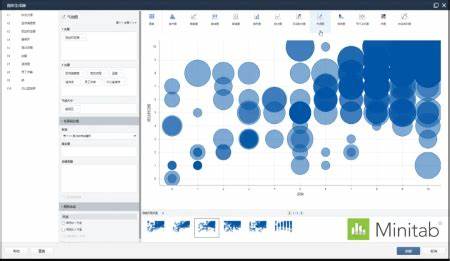
Sử dụng Trình tạo biểu đồ (Graph Builder), công cụ mới của Minitab Statistical Software để trực quan hóa, tạo và khám phá thông tin chi tiết của bạn ngay lập tức.
Với thư viện tương tác và dễ dàng sử dụng, Trình tạo biểu đồ cho phép bạn chuyển từ biểu đồ này sang biểu đồ tiếp theo bằng cách sử dụng cùng một dữ liệu mà không cần chạy lại phân tích, vì vậy bạn có thể tập trung vào việc chọn hình ảnh phù hợp với nhu cầu của mình.
Để sử dụng phần mềm thông kê Minitab, xem thêm: “Hướng dẫn cài đặt phần mềm Minitab mới nhất“
Ngoài ra, nếu có nhu cầu mua bản quyền Minitab, vui lòng liên hệ ngay với Minitab Việt Nam để được nhận báo giá và tư vấn về sản phẩm kỹ hơn:
Hotline: +84 98 332 06 55
Email: sale@minitabvietnam.com
Website: https://minitabvietnam.com/
Add: Tầng 4, Tòa nhà N01-T4, Khu Đoàn Ngoại Giao, P. XuânTảo, Q. Bắc Từ Liêm, TP. Hà Nội